




Now Reading: Analysis: How the White House is using misleading comparisons to make inflation sound better
-
01
Analysis: How the White House is using misleading comparisons to make inflation sound better
Analysis: How the White House is using misleading comparisons to make inflation sound better

The year-over-year inflation rate in January, the month President Donald Trump returned to the White House, was 3.0%.
The year-over-year inflation rate in September, the most recent month for which Consumer Price Index figures have been released, was … the same, 3.0%.
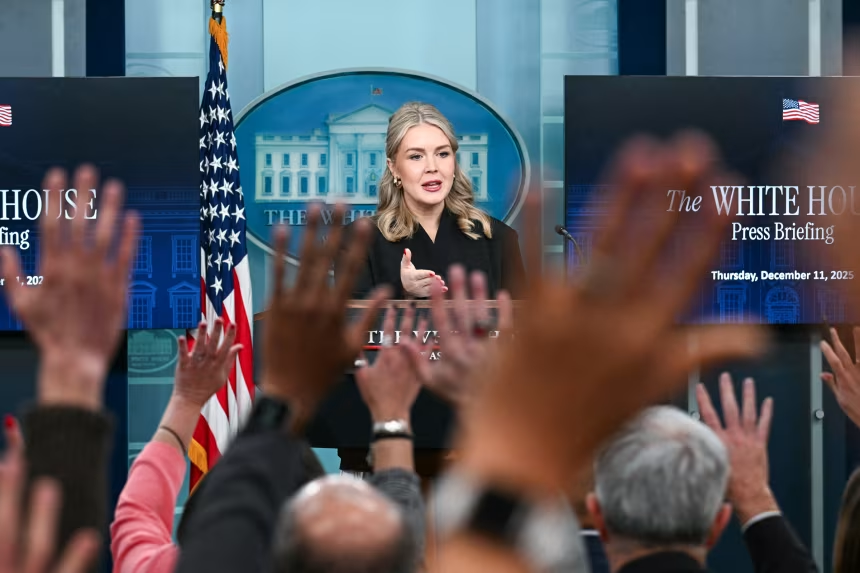
Trump’s team has chosen to use some misleading comparisons – deploying apples-to-oranges sets of statistics to serve Trump’s point. White House press secretary Karoline Leavitt tried it from the podium on Thursday.
Comparing a single month’s inflation rate to an eight-month annualized rate
But the inflation rate is not “trending in the right direction,” or at least wasn’t as of the most recent available numbers (the November numbers come out next week). In fact, September was the fifth consecutive month the year-over-year inflation rate increased from the month prior, Consumer Price Index figures show. Specifically, the rate was 2.3% in April, 2.4% in May, 2.67% in June, 2.7% in July, 2.9% in August, and, again, 3.0% in September.
Comparing the Biden-term peak to the Trump-term average
The comparison in that White House social media graphic was even more unmistakably misleading.
In large text, the graphic said “9.1% Inflation under Biden” and “2.7% Inflation under Trump.” Only in much smaller text did it explain that this, too, was an apples-to-oranges comparison.


Related Posts



Stay Informed With the Latest & Most Important News
Previous Post
Next Post








-
 01The US just took out two China-friendly leaders in two months. Why has Beijing done very little about it?
 -
 02EU warns that its trade with the US could be effectively wiped out if Trump follows through on his threat
 -
 03Imran Khan not the only one silenced as Pakistan military stifles dissent
 -
 04Photos: Zohran Mamdani becomes New York City’s first Muslim mayor
 -
 05New Trump peace proposal for Ukraine would require land concessions and military reduction, source says
 -
 06India crush New Zealand to win third T20 World Cup title
 -
 07Hopes of return to diplomacy as US-Iran hold fire for third day